

Memory Tuning#
It is necessary to specify how much memory Comet can use in addition to memory already allocated to Spark. In some cases, it may be possible to reduce the amount of memory allocated to Spark so that overall memory allocation is the same or lower than the original configuration. In other cases, enabling Comet may require allocating more memory than before. See the Determining How Much Memory to Allocate section for more details.
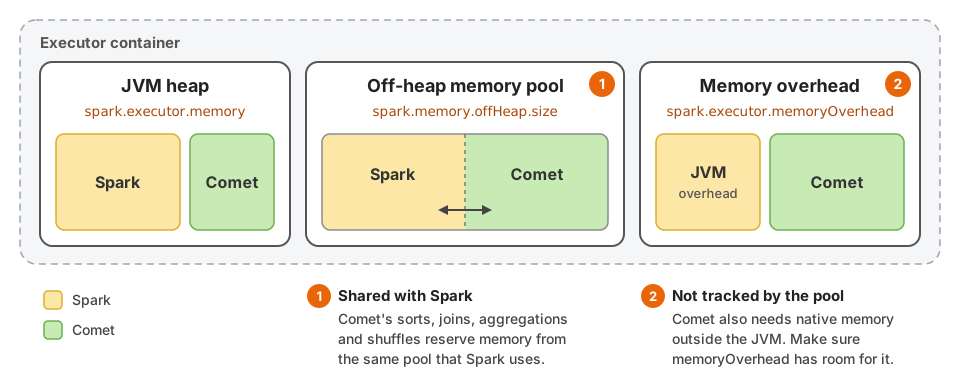
Comet needs two things configured: an off-heap pool for it to draw its reservations from, and enough executor memory overhead to cover the part of its footprint that no pool tracks. See Configuring Comet Memory and Configuring Executor Memory Overhead.
Configuring Comet Memory#
Comet shares an off-heap memory pool with Spark. The size of the pool is
specified by spark.memory.offHeap.size. The pool is a shared budget rather than a shared
allocator: Comet’s native operators allocate from the Rust heap rather than from JVM off-heap
memory, but every reservation they make is charged against this same pool, so Comet and Spark’s own
off-heap consumers draw down one number.
Comet’s memory pool only tracks memory that an operator explicitly reserves, which in practice means the batches an operator deliberately accumulates: the sort buffer, the build side of a hash join, hash aggregation state, and the shuffle writer’s buffered partitions. Memory that is not reserved is invisible to the pool no matter how much of it there is. That includes:
per-batch working memory in expression kernels and Arrow array builders,
decompression buffers and Parquet reader structures,
object store request buffers and the async runtime’s own machinery,
Arrow buffers allocated on the JVM side, which no budget covers at all,
allocator overhead: buffer padding, size-class rounding, fragmentation, and pages the allocator retains after a free rather than returning to the operating system.
Reserved memory is therefore a lower bound on what Comet really uses, and how far below it sits depends on the
workload. This is why Comet can stay within the pool’s limit and still push the executor past its container limit.
The part that is not counted has to fit in spark.executor.memoryOverhead, and each executor logs how large it is
while Comet runs; see Sizing the Overhead from the Memory Usage Log.
spark.comet.exec.memoryPool.fraction is deprecated and does not leave room for it. Spark hands out all of
spark.memory.offHeap.size to the tasks that ask for it, whatever the fraction. The fair_unified pool applies the
fraction to each task separately, where Spark’s own limit of an even share of the pool per running task is tighter
whenever more than one task is running, and the greedy_unified pool ignores it.
For more details about Spark off-heap memory mode, please refer to Spark documentation.
Comet implements multiple memory pool implementations. The type of pool can be specified with spark.comet.exec.memoryPool.
The valid pool types are:
fair_unified(default whenspark.memory.offHeap.enabled=trueis set)greedy_unified
Both pool types are shared by all the native plans in the same Spark task. A task can run more than one native plan at a time, for example the native operators on either side of a union or a coalesce. The shared pool ensures that their combined memory usage stays within the per-task limit.
The fair_unified pool prevents operators from using more than an even fraction of the available memory
(i.e. pool_size / num_consumers, where num_consumers counts the memory consumers registered by all of the task’s
native plans). This pool works best when you know beforehand
the query has multiple operators that will likely all need to spill. Sometimes it will cause spills even
when there is sufficient memory in order to leave enough memory for other operators.
Comet 0.15.0 through 1.0.0 capped the memory of all of a task’s operators combined at one operator’s share, because of a bug (#5961). Tasks with several operators can now reserve more memory before they spill than they could in those releases. The difference is largest on executors that run few tasks at once, where Spark’s own limit on each task is loosest. If you sized executor memory against one of those releases, check that executors still have enough headroom; see Sizing the Overhead from the Memory Usage Log.
The greedy_unified pool type implements a greedy first-come first-serve limit. This pool works well for queries that do not
need to spill or have a single spillable operator.
Configuring Executor Memory Overhead#
Enabling off-heap memory is not sufficient on its own. Comet also needs room in
spark.executor.memoryOverhead.
spark.memory.offHeap.size is a budget, and the cluster manager already sizes the executor
container to include it, so the memory that Comet’s operators explicitly reserve has room. What does
not have room is everything Comet allocates without reserving it — the untracked categories listed
under Configuring Comet Memory. Those allocations are made by the Rust global allocator and live
in the native heap, outside the JVM heap and outside Spark’s off-heap allocations, and nothing in
the container sizing accounts for them. The same applies to Comet’s JVM-side Arrow buffers.
spark.executor.memoryOverhead is the only slack the container has for this, and the JVM’s own
non-heap usage — metaspace, code cache, thread stacks, GC structures — is already drawing on it.
Work out what the executor already gets before choosing a value. When
spark.executor.memoryOverhead is unset, Spark derives the overhead as
max(spark.executor.memoryOverheadFactor * spark.executor.memory, 384 MiB). The factor defaults to
0.1, except for PySpark and SparkR applications submitted to Kubernetes in cluster mode, where it
defaults to 0.4. On Spark 4.0 and later the floor is configurable through
spark.executor.minMemoryOverhead. Setting spark.executor.memoryOverhead replaces the derived
value rather than adding to it, so a value below what is derived today shrinks the container instead
of growing it.
For a small executor, 2g is a reasonable starting point. A 4 GiB executor derives only 409 MiB, so
this is a real increase:
spark.executor.memoryOverhead=2g
A 32 GiB executor, on the other hand, already derives 3276 MiB, and the same setting would take away
1228 MiB. For executors that large, either pick an absolute value above what is derived today, or
raise spark.executor.memoryOverheadFactor instead so that the overhead keeps scaling with executor
size:
spark.executor.memoryOverheadFactor=0.2
Raise the value further if executors are killed by the cluster manager (on Kubernetes,
ExecutorLostFailure with exit code 137) rather than failing with a task-level out-of-memory error.
To measure how much Comet needs rather than guessing, see Sizing the Overhead from the Memory Usage Log.
Note that on Kubernetes and YARN the overhead is added to the container size, so raising it reduces how many executors fit on a node.
Sizing the Overhead from the Memory Usage Log#
While Comet native plans are running, each executor logs its native memory usage at INFO level, one line every 10 seconds for the whole executor:
Comet native memory usage: allocated 5412.3 MiB, reserved 3890.0 MiB (16 native plans, 8 memory pools)
allocatedis the memory that Comet’s native code has allocated and not yet freed, whether or not a pool tracks it.reservedis the part that Comet’s memory pools track. It is charged againstspark.memory.offHeap.size, so the container already has room for it.
The difference between the two, allocated - reserved, is Comet’s untracked native memory. It is
the part of Comet’s footprint that has to fit in spark.executor.memoryOverhead, alongside the
JVM’s own non-heap memory. To size the overhead from it:
Run a representative workload and find the line with the largest difference in each executor’s log. Take both figures from the same line: they are sampled together, and figures from different lines describe different moments. Setting
spark.comet.memory.logInterval=1sfor this run makes a short-lived peak less likely to fall between samples.Start from the overhead the executors had before Comet was enabled, which covers the JVM’s own non-heap memory, and add the largest difference seen on any executor.
Add a margin on top. The log can miss the true peak between samples, and neither figure includes the allocator’s fragmentation and retained pages, memory allocated by native C libraries such as zstd, or Comet’s Arrow buffers on the JVM side.
For example, a 16 GiB executor derives an overhead of 1638 MiB. If the largest difference in its
log is the 1522.3 MiB in the line above, the overhead needs to be at least 1638 + 1523 = 3161 MiB
before any margin, so spark.executor.memoryOverhead=4g would be a reasonable setting.
The executor also logs a warning when its native memory looks larger than its container allows:
when the difference, plus everything in use in Spark’s off-heap memory pool (which includes Comet’s
reservations), exceeds spark.memory.offHeap.size plus the memory overhead. This counts the part of
the off-heap pool that nothing has acquired at that moment, which untracked memory can occupy until
Spark hands it out, so a quiet log is not a sign that the overhead is large enough: size it from the
largest difference as described above. The overhead also has to hold the JVM’s own non-heap memory,
so by the time the warning appears the executor has likely outgrown its container. It warns the first time this
happens, and again each time it happens after dropping back below. The overhead it uses is
spark.executor.memoryOverhead if set, otherwise spark.executor.memoryOverheadFactor of
spark.executor.memory with a minimum of spark.executor.minMemoryOverhead, as Spark sizes the
default container. There is no warning in local mode.
Look more closely before raising the overhead if the difference keeps growing through a run rather
than levelling off: native memory that is not being released will exhaust any overhead eventually.
The executor logs one more line after its last native plan finishes, and an allocated figure there
that grows from one query to the next points the same way.
spark.comet.memory.logInterval is read when an executor starts its first Comet native plan, so set
it when the application is submitted. Set it to 0 to turn the log off.
Determining How Much Memory to Allocate#
Generally, increasing the amount of memory allocated to Comet will improve query performance by reducing the amount of time spent spilling to disk, especially for aggregate, join, and shuffle operations. Allocating insufficient memory can result in out-of-memory errors. This is no different from allocating memory in Spark and the amount of memory will vary for different workloads, so some experimentation will be required.
Here is a real-world example, based on running benchmarks derived from TPC-H, running on a single executor against local Parquet files using the 100 GB data set.
Baseline Spark Performance
Spark completes the benchmark in 632 seconds with 8 cores and 8 GB RAM
With less than 8 GB RAM, performance degrades due to spilling
Spark can complete the benchmark with as little as 3 GB of RAM, but with worse performance (744 seconds)
Comet Performance
Comet requires at least 5 GB of RAM, but performance at this level is around 340 seconds, which is significantly faster than Spark with any amount of RAM
Comet running in off-heap with 8 cores completes the benchmark in 295 seconds, more than 2x faster than Spark
It is worth noting that running Comet with only 4 cores and 4 GB RAM completes the benchmark in 520 seconds, providing better performance than Spark for half the resource
It may be possible to reduce Comet’s memory overhead by reducing batch sizes or increasing number of partitions.
Batch Size#
Comet processes data in columnar batches. The batch size is controlled by spark.comet.batchSize (default
8192 rows). Larger batches generally improve throughput by amortizing per-batch overhead, but they also
increase peak memory usage — a batch holds all projected columns in Arrow format at once. Reduce this value
if you see frequent spilling or out-of-memory errors on wide tables; increase it (for example to 16384) on
narrow tables when memory is plentiful.
spark.comet.shuffle.jvm.batchSize controls the batch size used when the JVM columnar shuffle writer
flushes sorted spill files. It must not exceed spark.comet.batchSize.
Limiting Spill Disk Usage#
Native operators that spill to disk (aggregate, sort, shuffle) are bounded by
spark.comet.maxTempDirectorySize (default 100 GB). The operators of one Comet native plan share
the limit. A Spark task can run more than one native plan at a time, for example the native
operators on either side of a union or a coalesce, so an executor running N concurrent tasks may
use more than N times this value on shared local disks. If the limit is reached, further spills
fail and the query errors out. Raise this on workloads with large sort/aggregate/shuffle spills, or
lower it to protect executors on shared disks, remembering that the total across an executor is a
multiple of this value.