Profiling Native Code#
We use cargo bench to run benchmarks to measure the performance of individual operators and expressions
and cargo-flamegraph for profiling.
Running micro benchmarks with cargo bench#
When implementing a new operator or expression, it is good practice to add a new microbenchmark under core/benches.
It is often easiest to copy an existing benchmark and modify it for the new operator or expression. It is also
necessary to add a new section to the Cargo.toml file, such as:
[[bench]]
name = "shuffle_writer"
harness = false
These benchmarks are useful when for comparing performance between releases or between feature branches and the main branch to help prevent regressions in performance when adding new features or fixing bugs.
Individual benchmarks can be run by name with the following command.
cargo bench shuffle_writer
Here is some sample output from running this command.
     Running benches/shuffle_writer.rs (target/release/deps/shuffle_writer-e37b59e37879cce7)
Gnuplot not found, using plotters backend
shuffle_writer/shuffle_writer
                        time:   [2.0880 ms 2.0989 ms 2.1118 ms]
Found 9 outliers among 100 measurements (9.00%)
  3 (3.00%) high mild
  6 (6.00%) high severe
Profiling with cargo-flamegraph#
Install cargo-flamegraph:
cargo install flamegraph
Follow the instructions in cargo-flamegraph for your platform for running flamegraph.
Here is a sample command for running cargo-flamegraph on MacOS.
cargo flamegraph --root --bench shuffle_writer
This will produce output similar to the following.
dtrace: system integrity protection is on, some features will not be available

dtrace: description 'profile-997 ' matched 1 probe
Gnuplot not found, using plotters backend
Testing shuffle_writer/shuffle_writer
Success

dtrace: pid 66402 has exited
writing flamegraph to "flamegraph.svg"
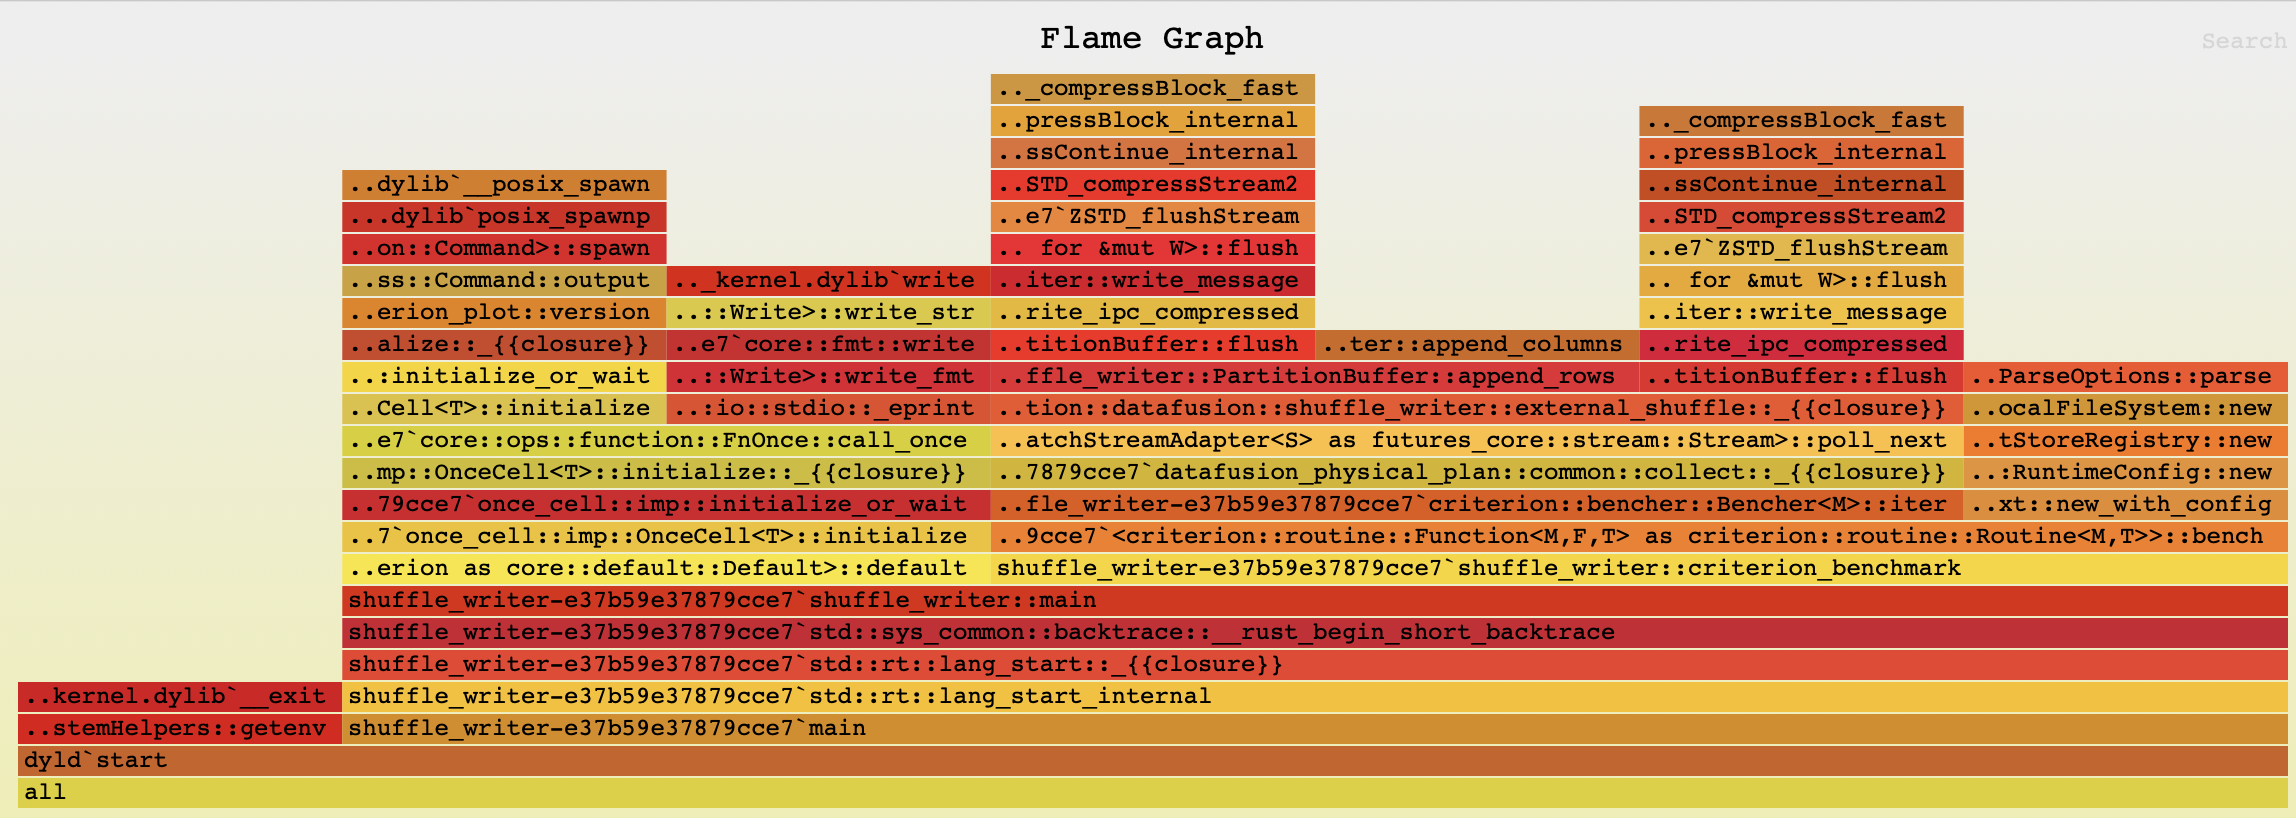
The generated flamegraph can now be opened in a browser that supports svg format.
Here is the flamegraph for this example: