Tracing#
Tracing can be enabled by setting spark.comet.tracing.enabled=true.
With this feature enabled, each Spark executor will write a JSON event log file in
Chrome’s Trace Event Format. The file will be written to the executor’s current working
directory with the filename comet-event-trace.json.
Additionally, enabling the jemalloc feature will enable tracing of native memory allocations.
make release COMET_FEATURES="jemalloc"
Example output:
{ "name": "decodeShuffleBlock", "cat": "PERF", "ph": "B", "pid": 1, "tid": 5, "ts": 10109225730 },
{ "name": "decodeShuffleBlock", "cat": "PERF", "ph": "E", "pid": 1, "tid": 5, "ts": 10109228835 },
{ "name": "decodeShuffleBlock", "cat": "PERF", "ph": "B", "pid": 1, "tid": 5, "ts": 10109245928 },
{ "name": "decodeShuffleBlock", "cat": "PERF", "ph": "E", "pid": 1, "tid": 5, "ts": 10109248843 },
{ "name": "executePlan", "cat": "PERF", "ph": "E", "pid": 1, "tid": 5, "ts": 10109350935 },
{ "name": "getNextBatch[JVM] stage=2", "cat": "PERF", "ph": "E", "pid": 1, "tid": 5, "ts": 10109367116 },
{ "name": "getNextBatch[JVM] stage=2", "cat": "PERF", "ph": "B", "pid": 1, "tid": 5, "ts": 10109479156 },
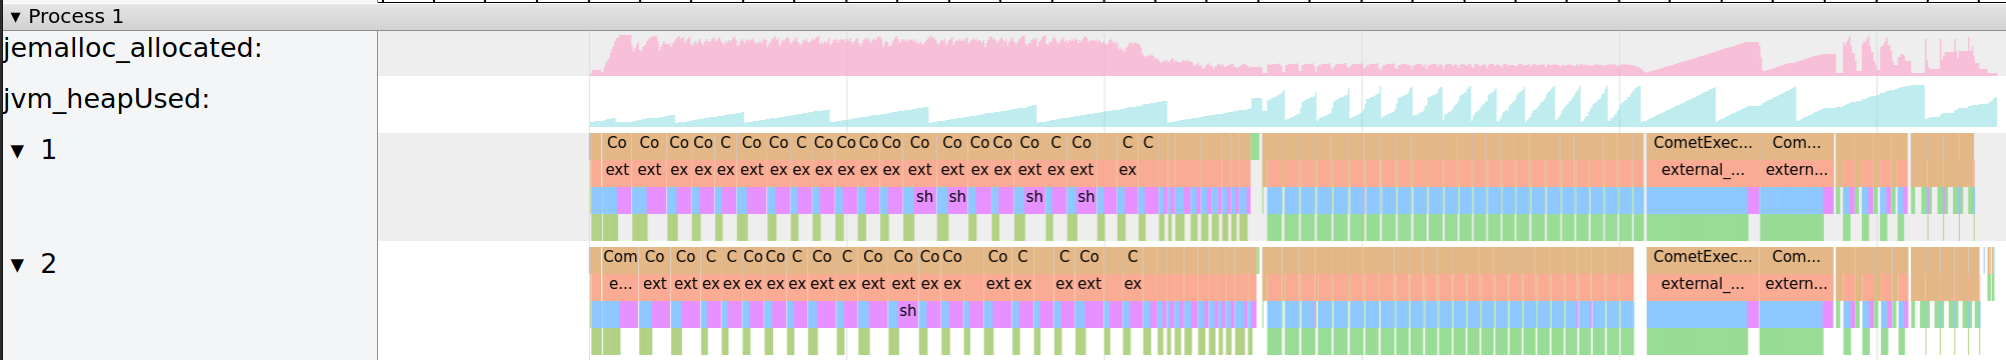
Traces can be viewed with Perfetto UI.
Example trace visualization:
Analyzing Memory Usage#
The analyze_trace tool parses a trace log and compares jemalloc usage against the sum of per-thread
Comet memory pool reservations. This is useful for detecting untracked native memory growth where jemalloc
allocations exceed what the memory pools account for.
Build and run:
cd native
cargo run --bin analyze_trace -- /path/to/comet-event-trace.json
The tool reads counter events from the trace log. Because tracing logs metrics per thread, jemalloc_allocated
is a process-wide value (the same global allocation reported from whichever thread logs it), while
thread_NNN_comet_memory_reserved values are per-thread pool reservations that are summed to get the total
tracked memory.
Sample output:
=== Comet Trace Memory Analysis ===

Counter events parsed: 193104
Threads with memory pools: 8
Peak jemalloc allocated:   3068.2 MB
Peak pool total:           2864.6 MB
Peak excess (jemalloc - pool): 364.6 MB

WARNING: jemalloc exceeded pool reservation at 138 sampled points:

     Time (us)        jemalloc      pool_total          excess
--------------------------------------------------------------
        179578        210.8 MB          0.1 MB        210.7 MB
        429663        420.5 MB        145.1 MB        275.5 MB
       1304969       2122.5 MB       1797.2 MB        325.2 MB
      21974838        407.0 MB         42.3 MB        364.6 MB
      33543599          5.5 MB          0.1 MB          5.3 MB

--- Final per-thread pool reservations ---

  thread_60_comet_memory_reserved: 0.0 MB
  thread_95_comet_memory_reserved: 0.0 MB
  thread_96_comet_memory_reserved: 0.0 MB
  ...

  Total: 0.0 MB
Some excess is expected (jemalloc metadata, fragmentation, non-pool allocations like Arrow IPC buffers). Large or growing excess may indicate memory that is not being tracked by the pool.
Definition of Labels#
Label |
Meaning |
|---|---|
jvm_heap_used |
JVM heap memory usage of live objects for the executor process |
jemalloc_allocated |
Native memory usage for the executor process (requires |
thread_NNN_comet_memory_reserved |
Memory reserved by Comet’s DataFusion memory pool (summed across all contexts on the thread). NNN is the Rust thread ID. |
thread_NNN_comet_jvm_shuffle |
Off-heap memory allocated by Comet for columnar shuffle. NNN is the Rust thread ID. |