

Profiling Cookbook#
The section contains examples how to perform CPU profiling for Apache DataFusion on different operating systems.
Building a flame graph#
Video: how to CPU profile DataFusion with a Flamegraph
A flamegraph is a visual representation of which functions are being run You can create flamegraphs in many ways; The instructions below are for cargo-flamegraph which results in images such as this:

MacOS#
Step 1: Install the flamegraph Tool#
To install flamegraph, run:
cargo install flamegraph
Step 2: Prepare Your Environment#
Ensure that you’re in the directory containing the necessary data files for your DataFusion query. The flamegraph tool will profile the execution of your query against this data.
Step 3: Running the Flamegraph Tool#
To generate a flamegraph, you’ll need to use the -- separator to pass arguments to the binary you’re profiling. For datafusion-cli, you need to make sure to run the command with sudo permissions (especially on macOS, where DTrace requires elevated privileges).
Here is a general example:
sudo flamegraph -- datafusion-cli -f <path_to_sql_file/sql_file.sql>
Example: Generating a Flamegraph for a Specific Query#
Here is an example using 28.sql:
sudo flamegraph -- datafusion-cli -f 28.sql
You can also invoke the flamegraph tool with cargo to profile a specific test or benchmark.
Example: Flamegraph for a specific test:#
CARGO_PROFILE_RELEASE_DEBUG=true cargo flamegraph --root --unit-test datafusion -- dataframe::tests::test_array_agg
Example: Flamegraph for a benchmark#
CARGO_PROFILE_RELEASE_DEBUG=true cargo flamegraph --root --bench sql_planner -- --bench
CPU profiling with XCode Instruments#
Profiling using Samply cross platform profiler#
There is an opportunity to build flamegraphs, call trees and stack charts on any platform using Samply
Install Samply profiler
cargo install --locked samply
More Samply installation options
Run the profiler
samply record --profile profiling ./my-application my-arguments
Profile the benchmark#
Set up benchmarks if not yet done
Example: Profile Q22 query from TPC-H benchmark.
Note: --profile profiling to profile release optimized artifact with debug symbols
cargo build --profile profiling --bin tpch
samply record ./target/profiling/tpch benchmark datafusion --iterations 5 --path datafusion/benchmarks/data/tpch_sf10 --prefer_hash_join true --format parquet -o datafusion/benchmarks/results/dev2/tpch_sf10.json --query 22
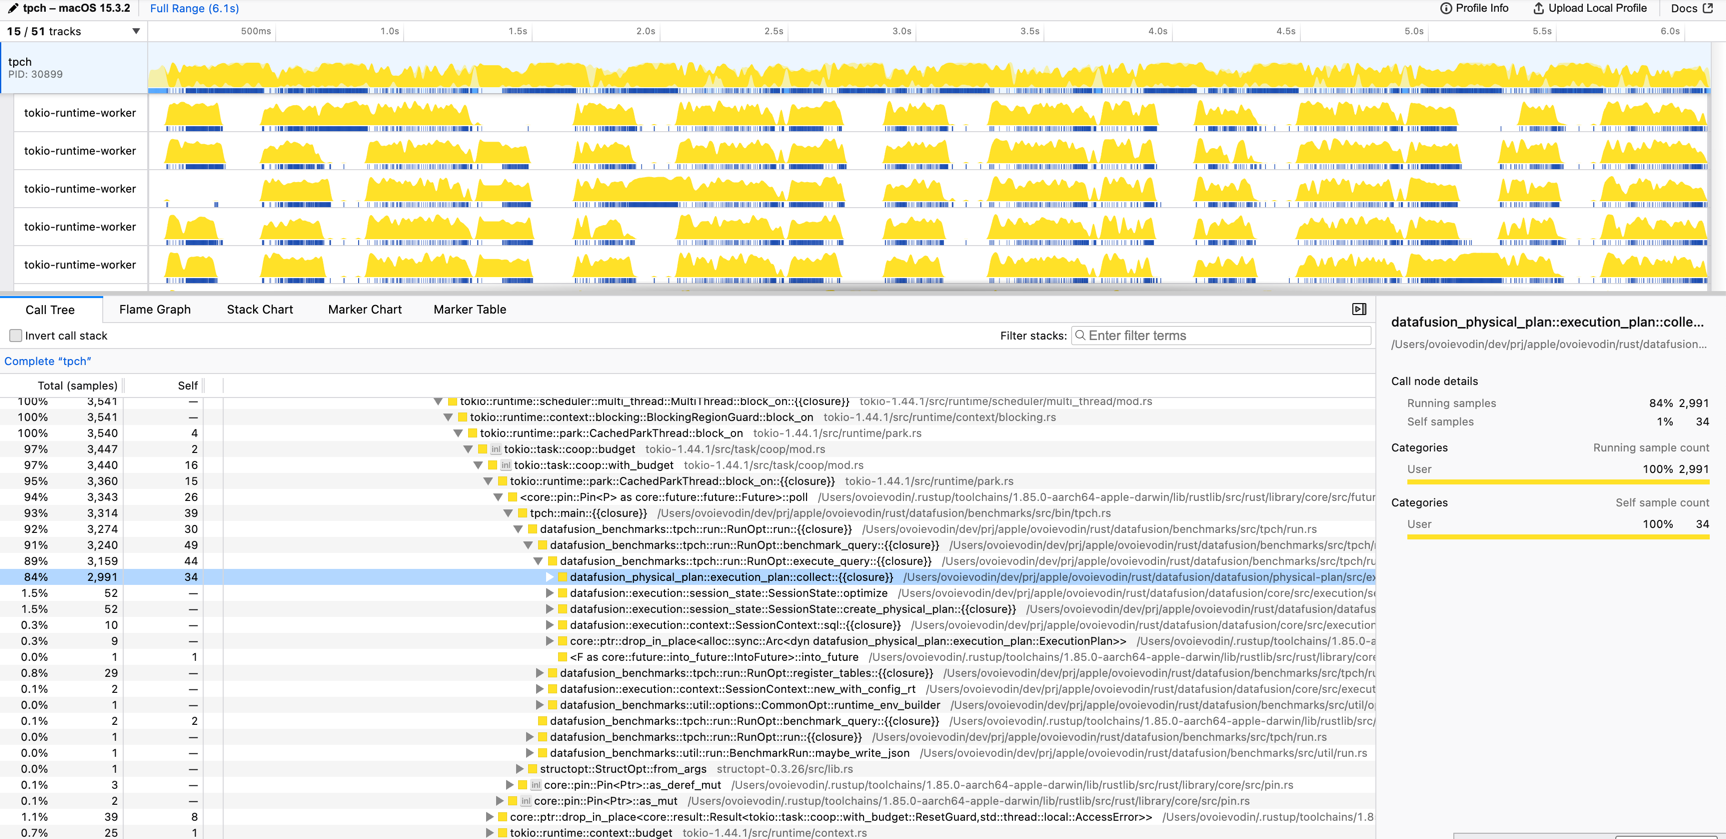
After sampling has completed the Samply starts a local server and navigates to the profiler
Local server listening at http://127.0.0.1:3000
Note: The Firefox profiler cannot be opened in Safari, please use Chrome or Firefox instead